Third class worked in pairs and collected data from all pupils from 1st to 6th class. Theses were the chosen topics for the survey:
- Our Favourite Sweets
- Our Favourite Sports
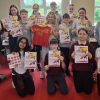
- Our Roald Dahl Books

Once they collected all the data, each group used Excel to record the data and then used the chart wizard to create bar charts


Each group then customised their charts by selecting different colours from the custom palette of colours and made some formatting changes to the text by increasing the size of the text and changing the font.